Explore our comprehensive collection of food microbiome visualizations, showcasing various analytical approaches and research findings from the Food Microbiome Project.

Diversity and Composition
Microbial diversity and composition across different groups.

Correlation & Differential Analysis
Mantel's test heatmap showing correlations between environmental factors and microbial species, and volcano plot displaying significantly enriched/depleted genera between groups.

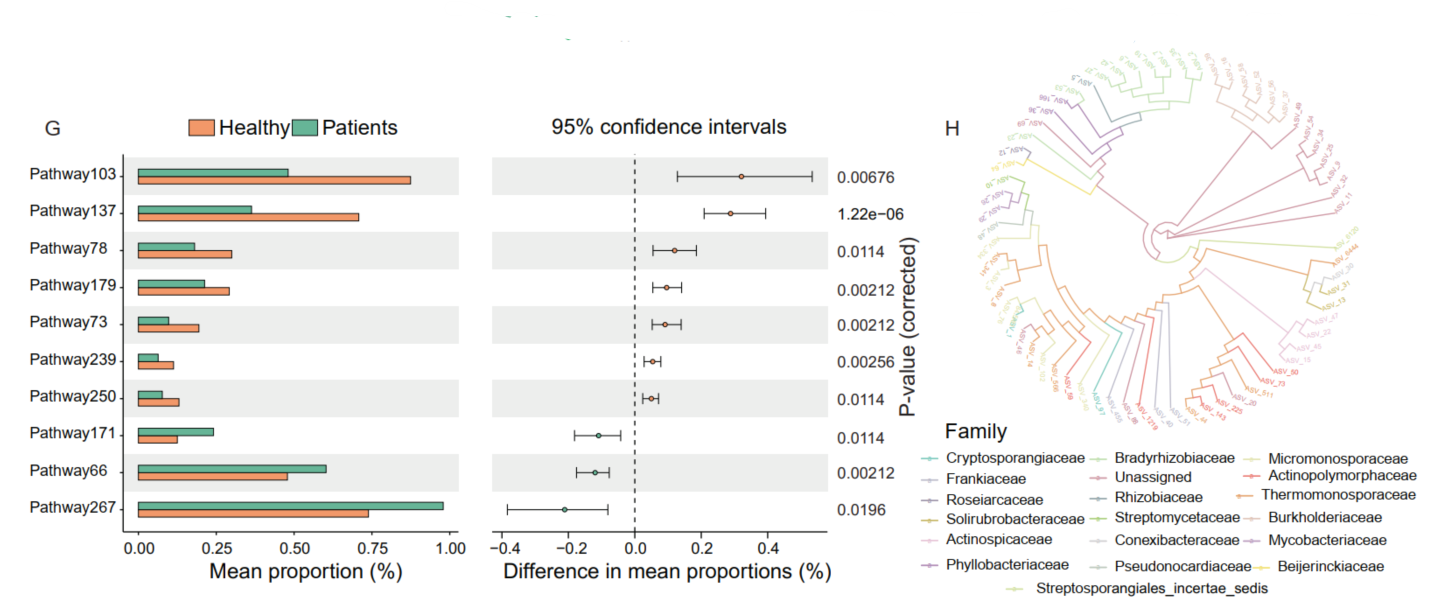
Pathway Analysis & Phylogenetic Tree
Extended error-bar plot showing pathway differences between groups with relative abundance and statistical significance, and phylogenetic tree of ASVs with branches colored by families.

Functional Annotation
Functional annotations of assembled contigs across categories with protein overlaps, and KEGG classification of functional genes at multiple levels.

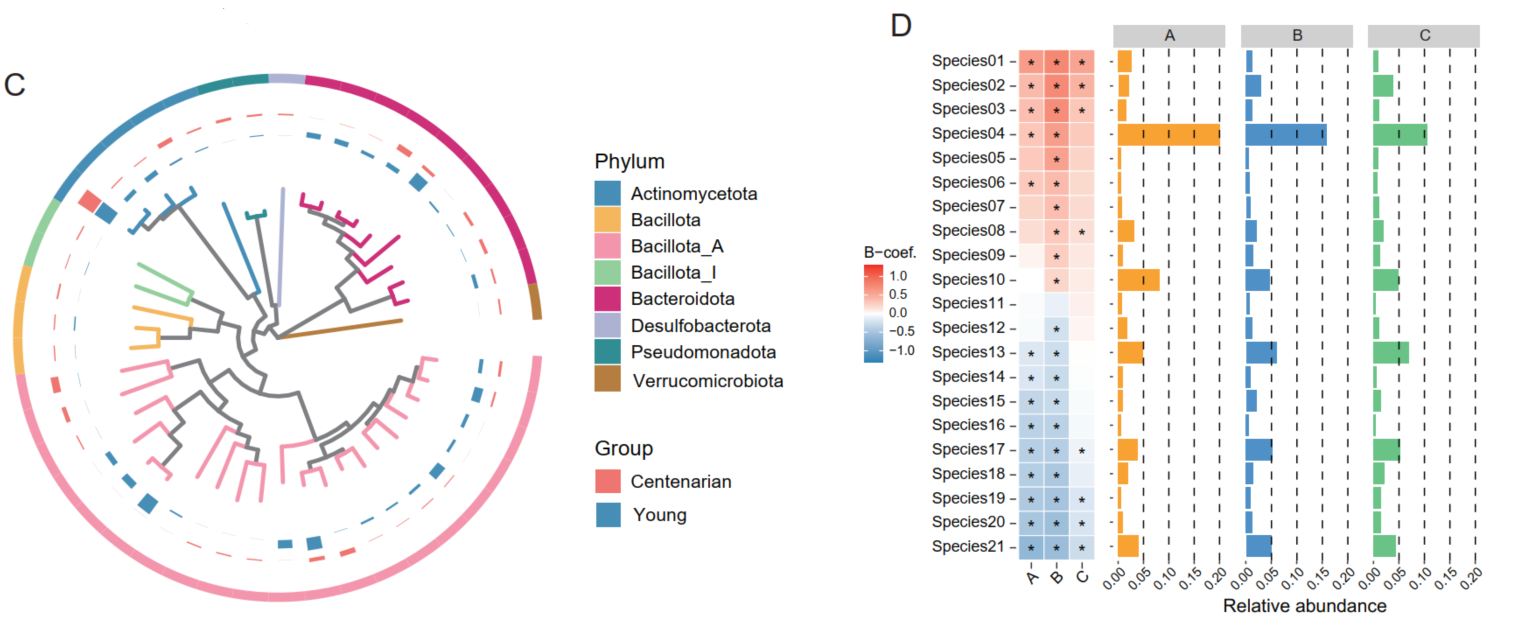
Phylogenetic Tree & Species Analysis
Phylogenetic tree of MAGs with prevalence histograms for different groups, and differential analysis heatmap with relative abundance bar charts.

CAZy Functional Gene Analysis
CAZy functional gene annotations within MAGs, illustrating the distribution of key carbohydrate-active genes across MAGs.

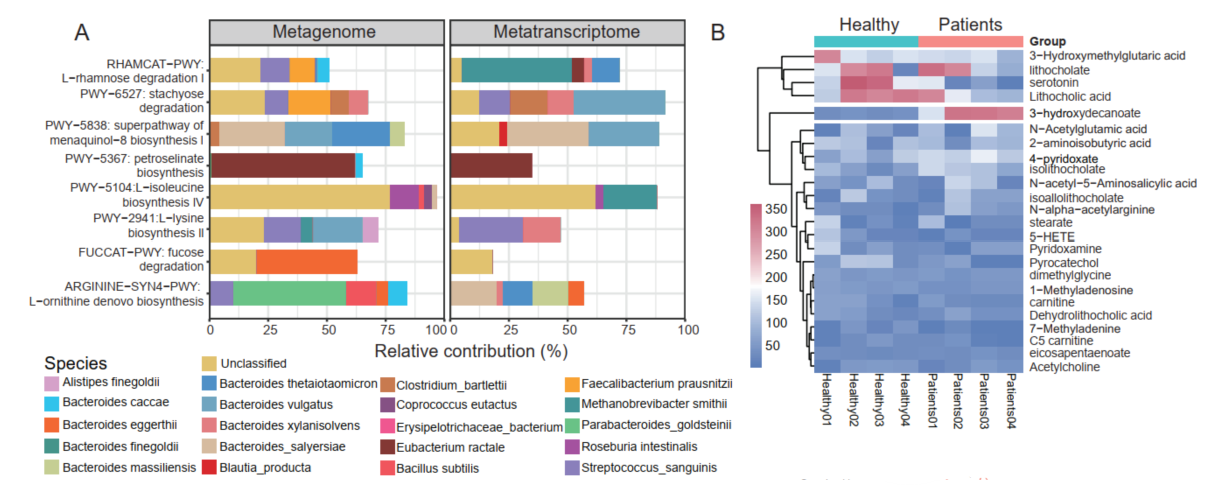
Metabolism Comparison Analysis
Comparison of metagenome and metatranscriptome metabolism results with species pathway contributions, and metabolite comparison heatmap between groups.

VIP Score & Correlation Network
Variable influence on projection (VIP) scores showing metabolite importance by category, and Spearman correlation network of species and metabolites with correlation strength.

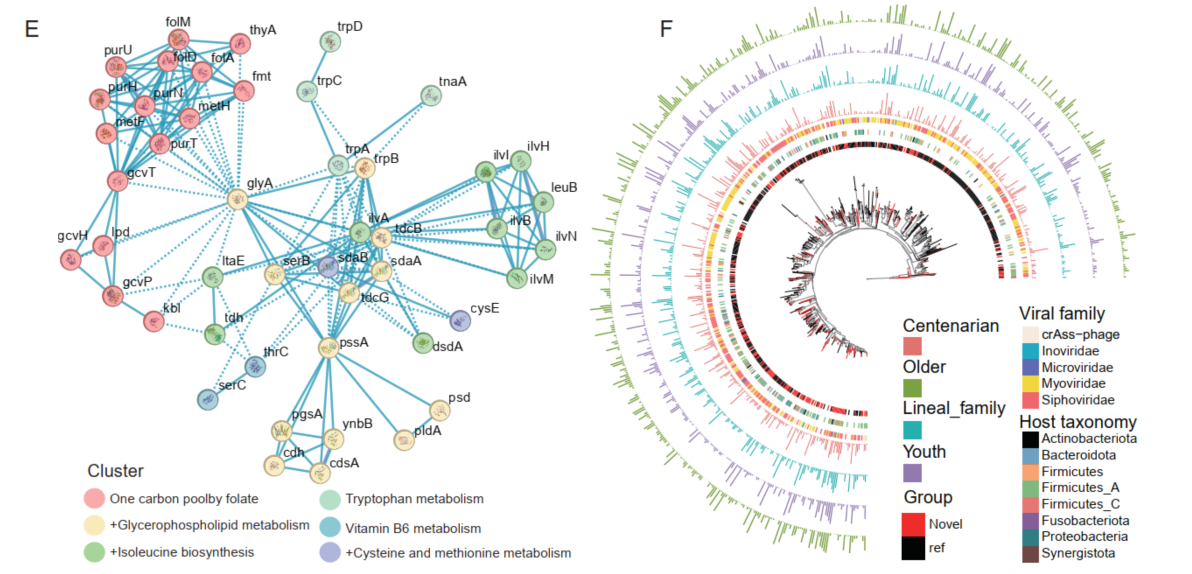
Protein Interaction & Viral Phylogenetic Analysis
Protein-protein interaction network with clusters, and phylogenetic tree of viral OTUs with host discrimination, family classification, and group prevalence.
 Diversity
 Correlation
 Pathway
 Functional
 Phylogenetic
 CAZy
CAZy
 Metabolism
 Network
 Protein
 Diversity
 Correlation
 Pathway
 Functional
 Phylogenetic
 CAZy
CAZy
 Metabolism
 Network
 Protein

